Ralative Strength Video
Hi Marty,
Thank you for the educational video,
Is this filter the only filter you use to identify your leaders or actionable ideas?
I want to lear how do you identify, narrow down the stocks each weekend or pre/after market.
What are the ways you use to make a watchlist actively?
Thanks
Oz
Oz,
I use many filters to screen for stocks, and will include more videos this week. I should have done this a long time ago. The stocks showing relative strength are most likely not the stocks to be trading in a base as most of them are advancing more rapidly than the index. Those stocks have momentum and are probably best for day or swing trades.
I want to buy stocks that have consolidated for at least eight weeks and formed some type of base. I also like stocks that are trading tight within a base, and not wide and loose.
URI is a good example of a stock trading tight within its base before it made its big move. It really illustrates the tight trading on the weekly chart below.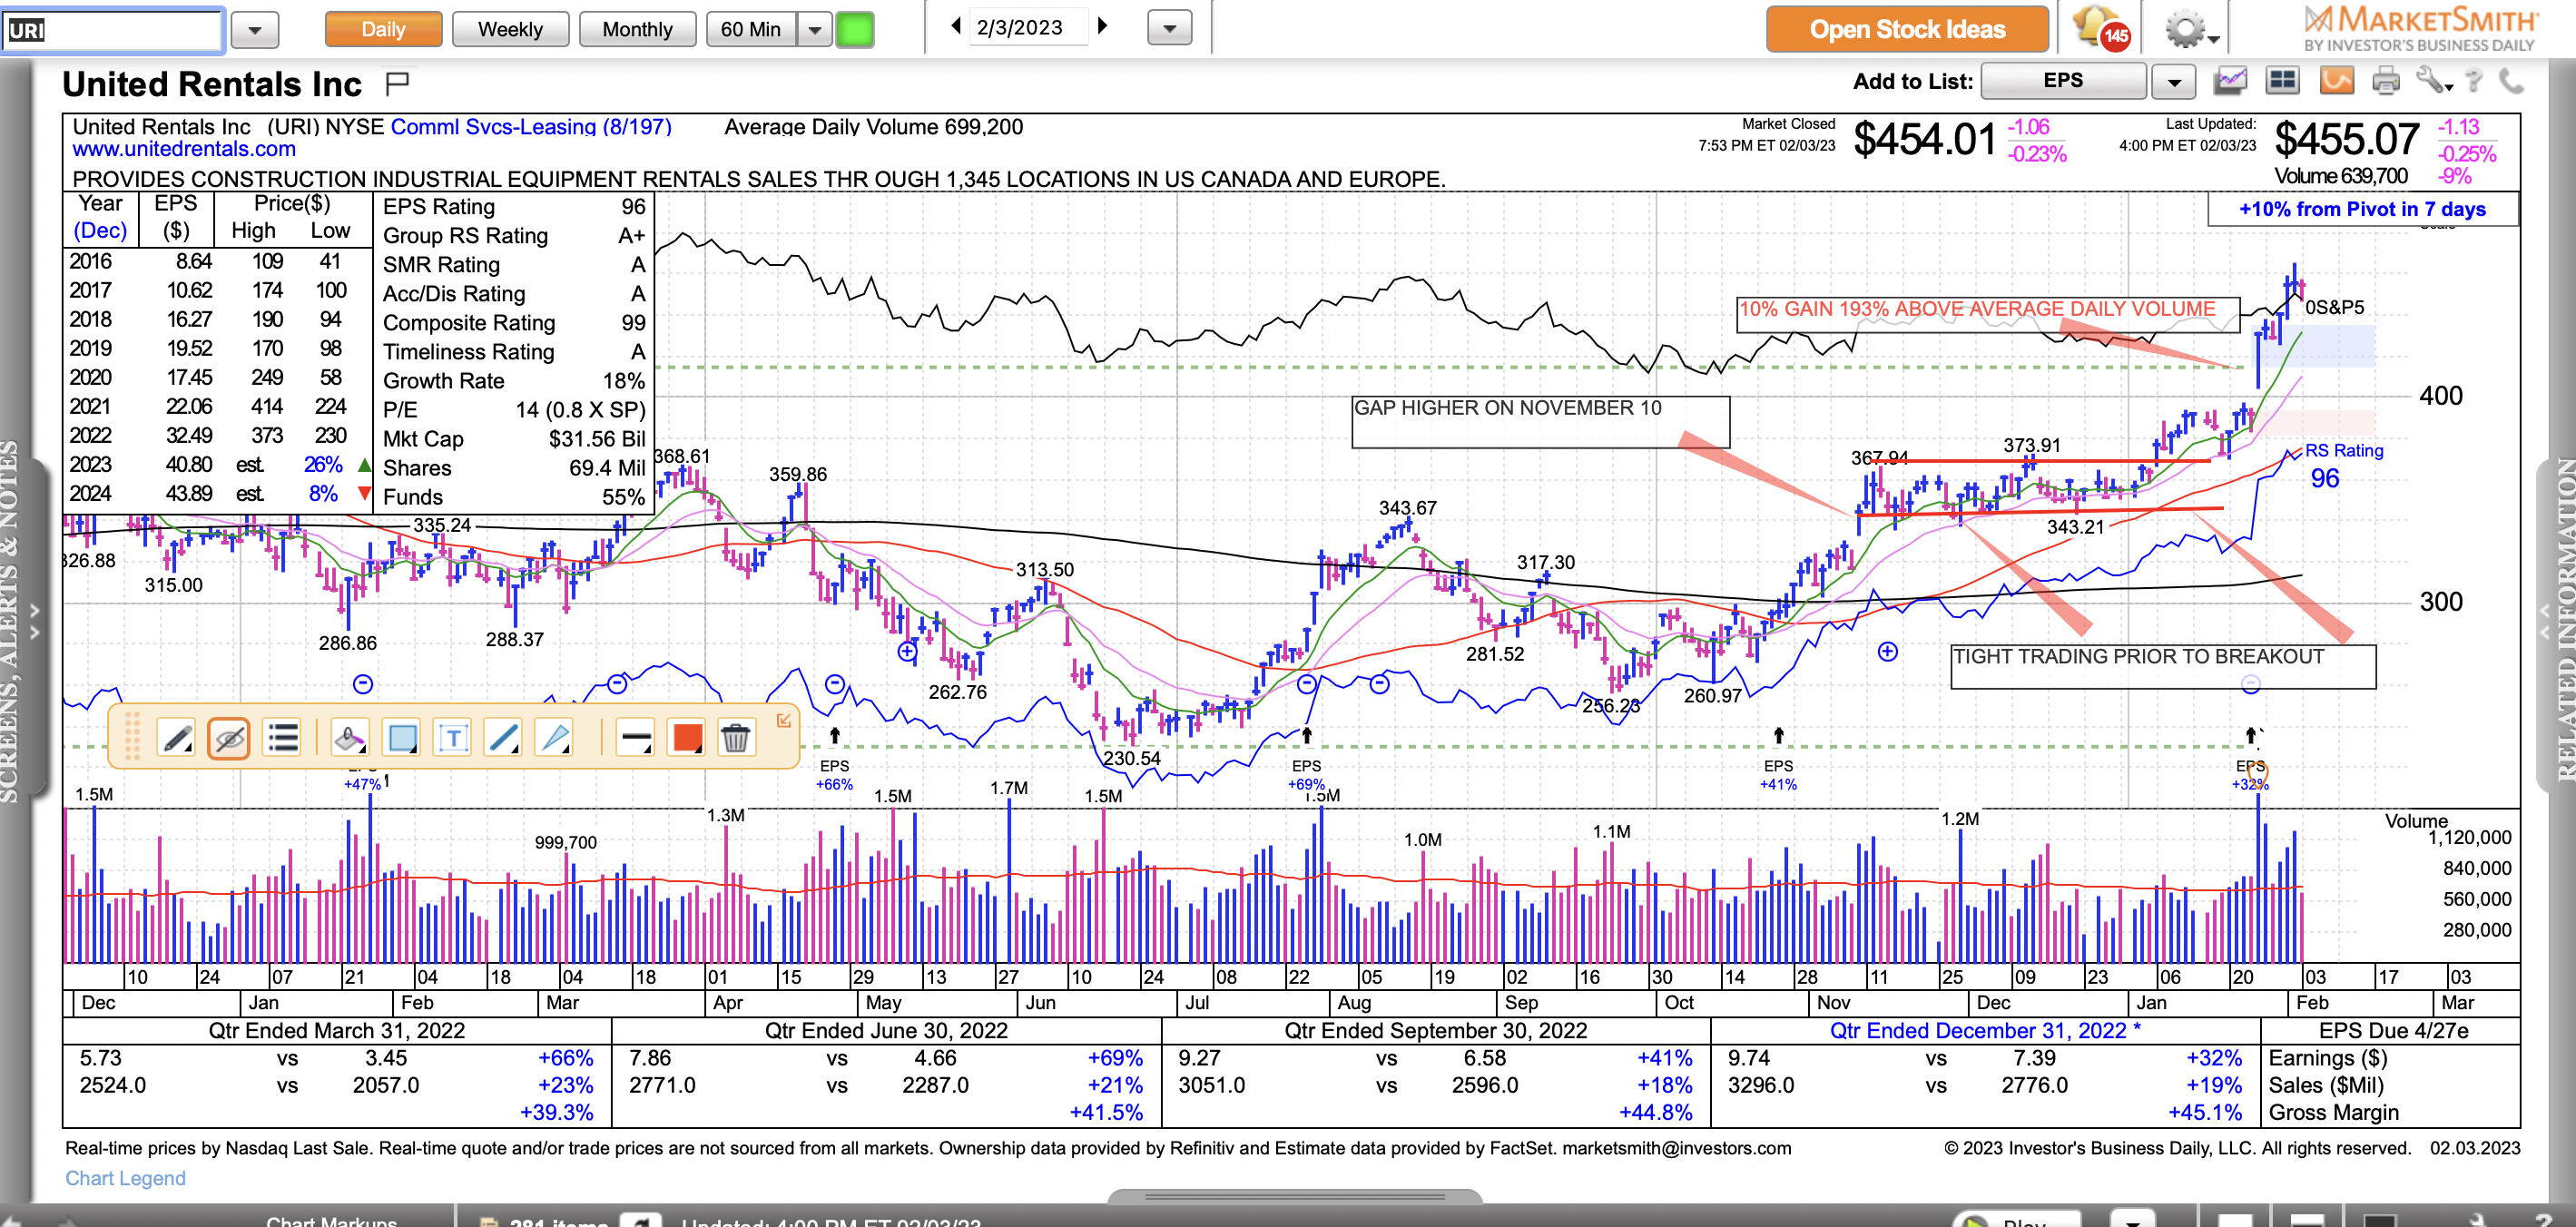
 UBER is a different example of finding a a stock with multiple buy points. The early buy point that I used of $29.60 was when it broke its downtrend line from last September. Remember when drawing a downtrend line the more times it touches the line the better. But, it needs to touch the downtrend line a MINIMUM of three times before it becomes a legitimate set-up. It broke above the $29.60 level and traded near another standard buy point from a cup with handle pattern. That buy point is $31.20 which is the high in the handle.
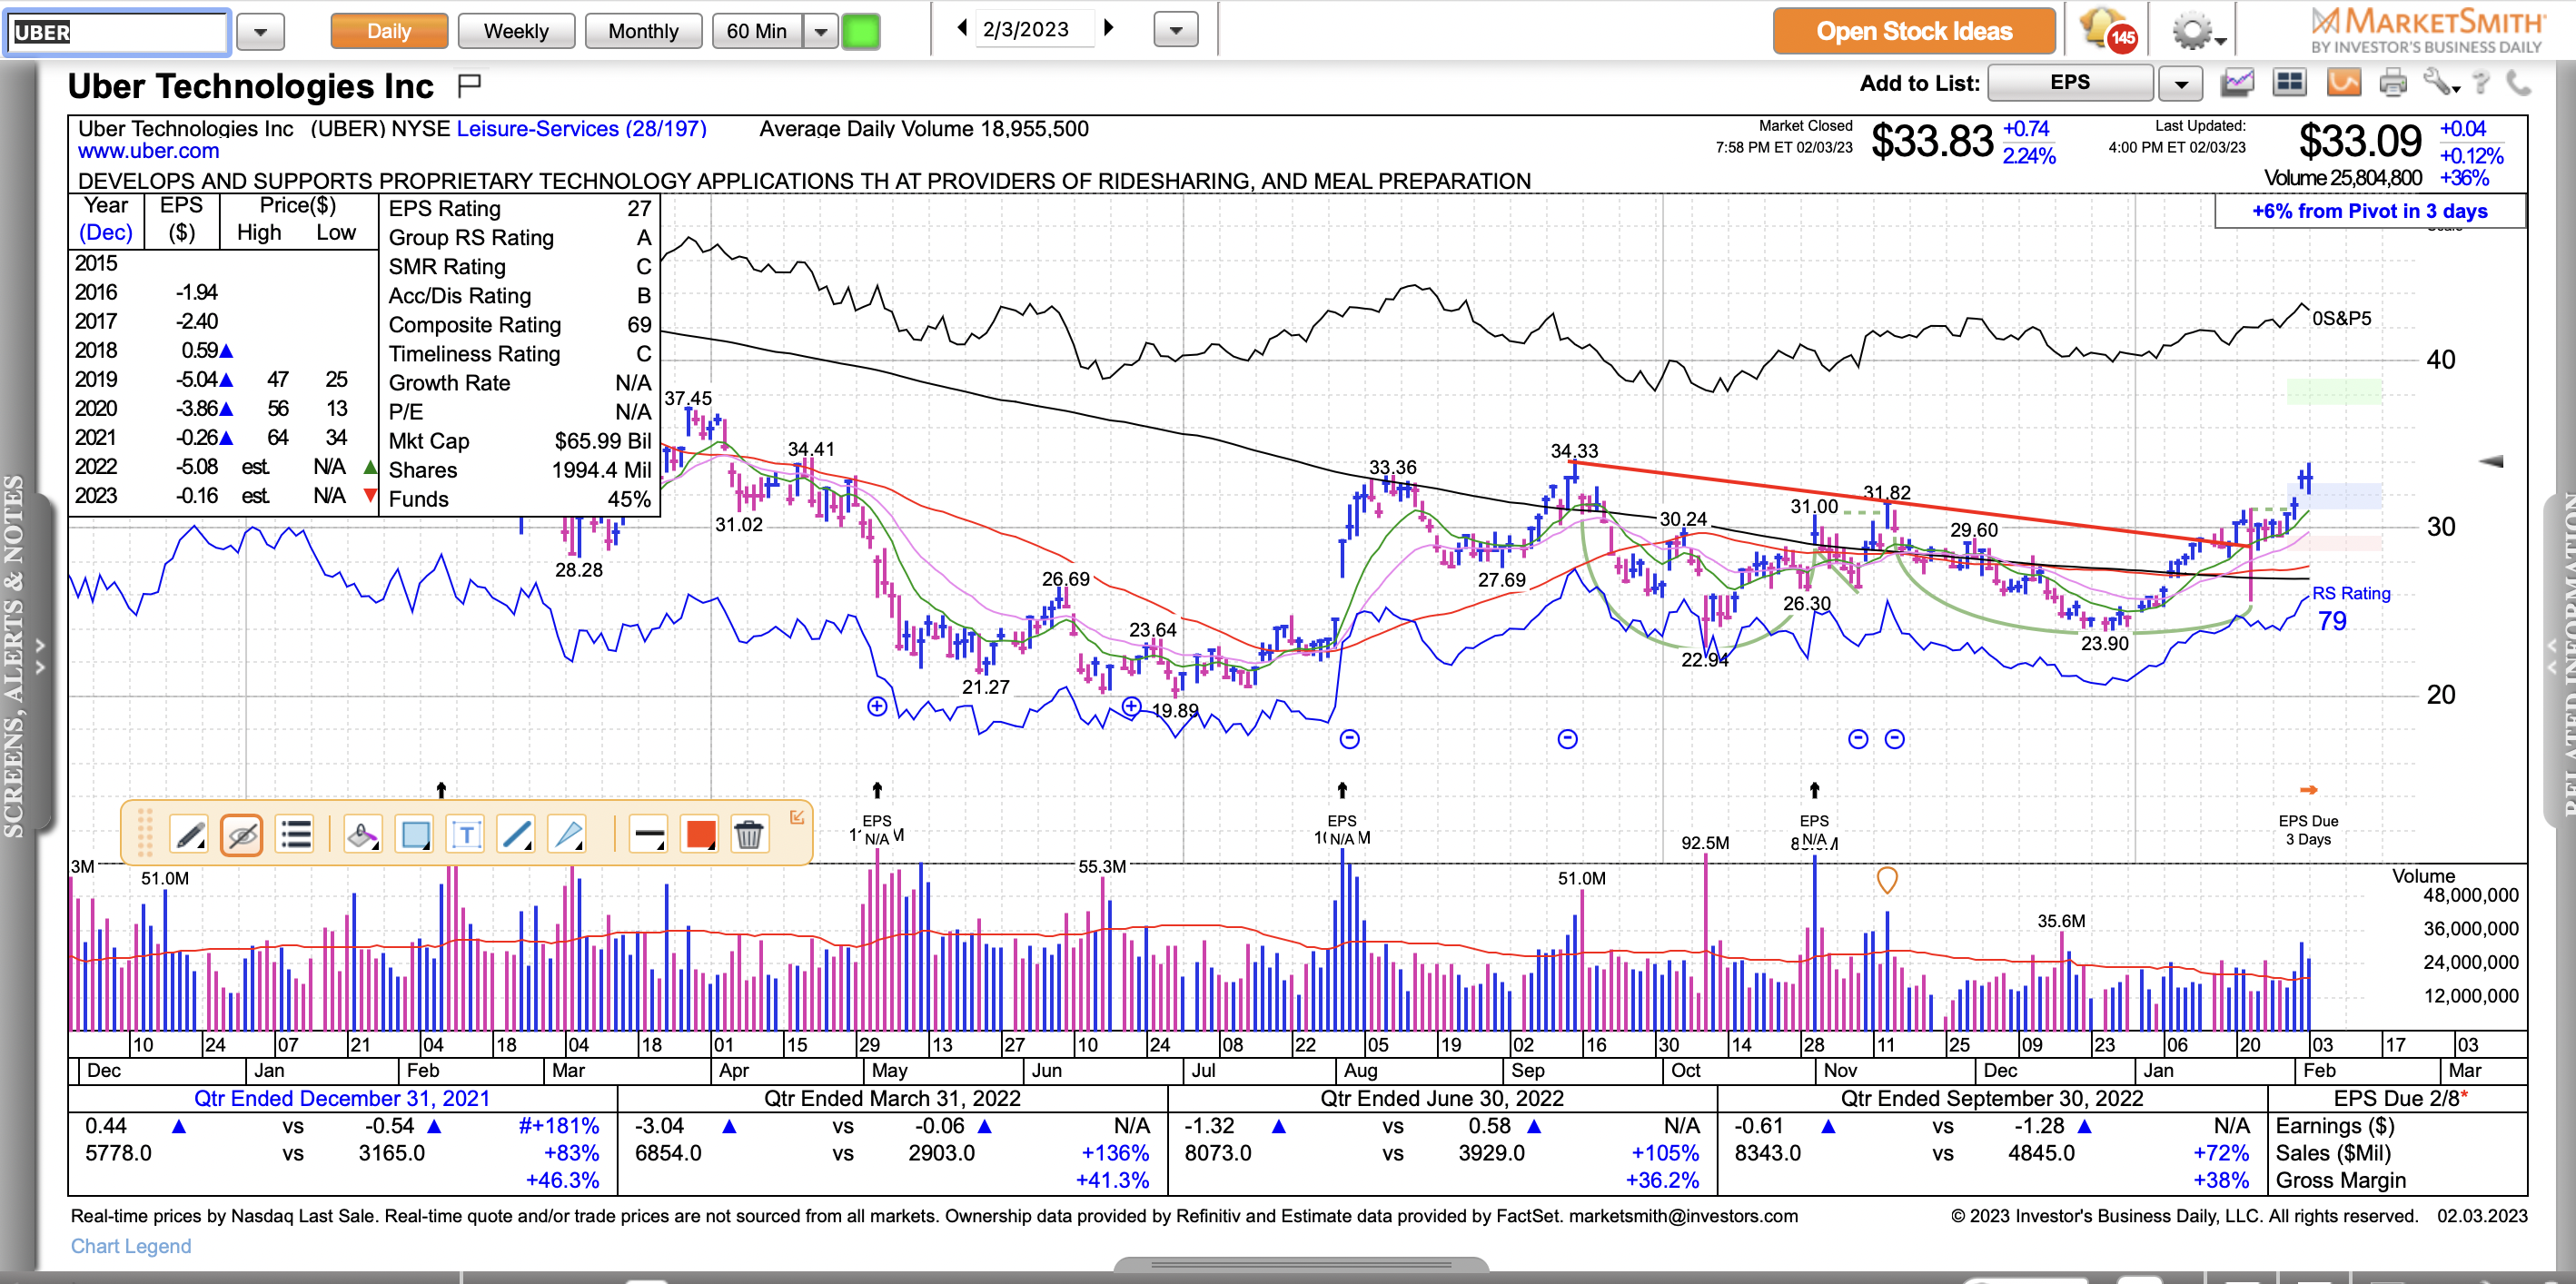 The weekly chart shows the length of the correction and the recent consolidation. It also shows the overhead supply in this stock. This chart shows an additional buy point at $34.33. Therefore, even though this stock may seem extended from an early entry buy point, it may have more room to run, and that is why it is important to check multiple time frames for buy points.
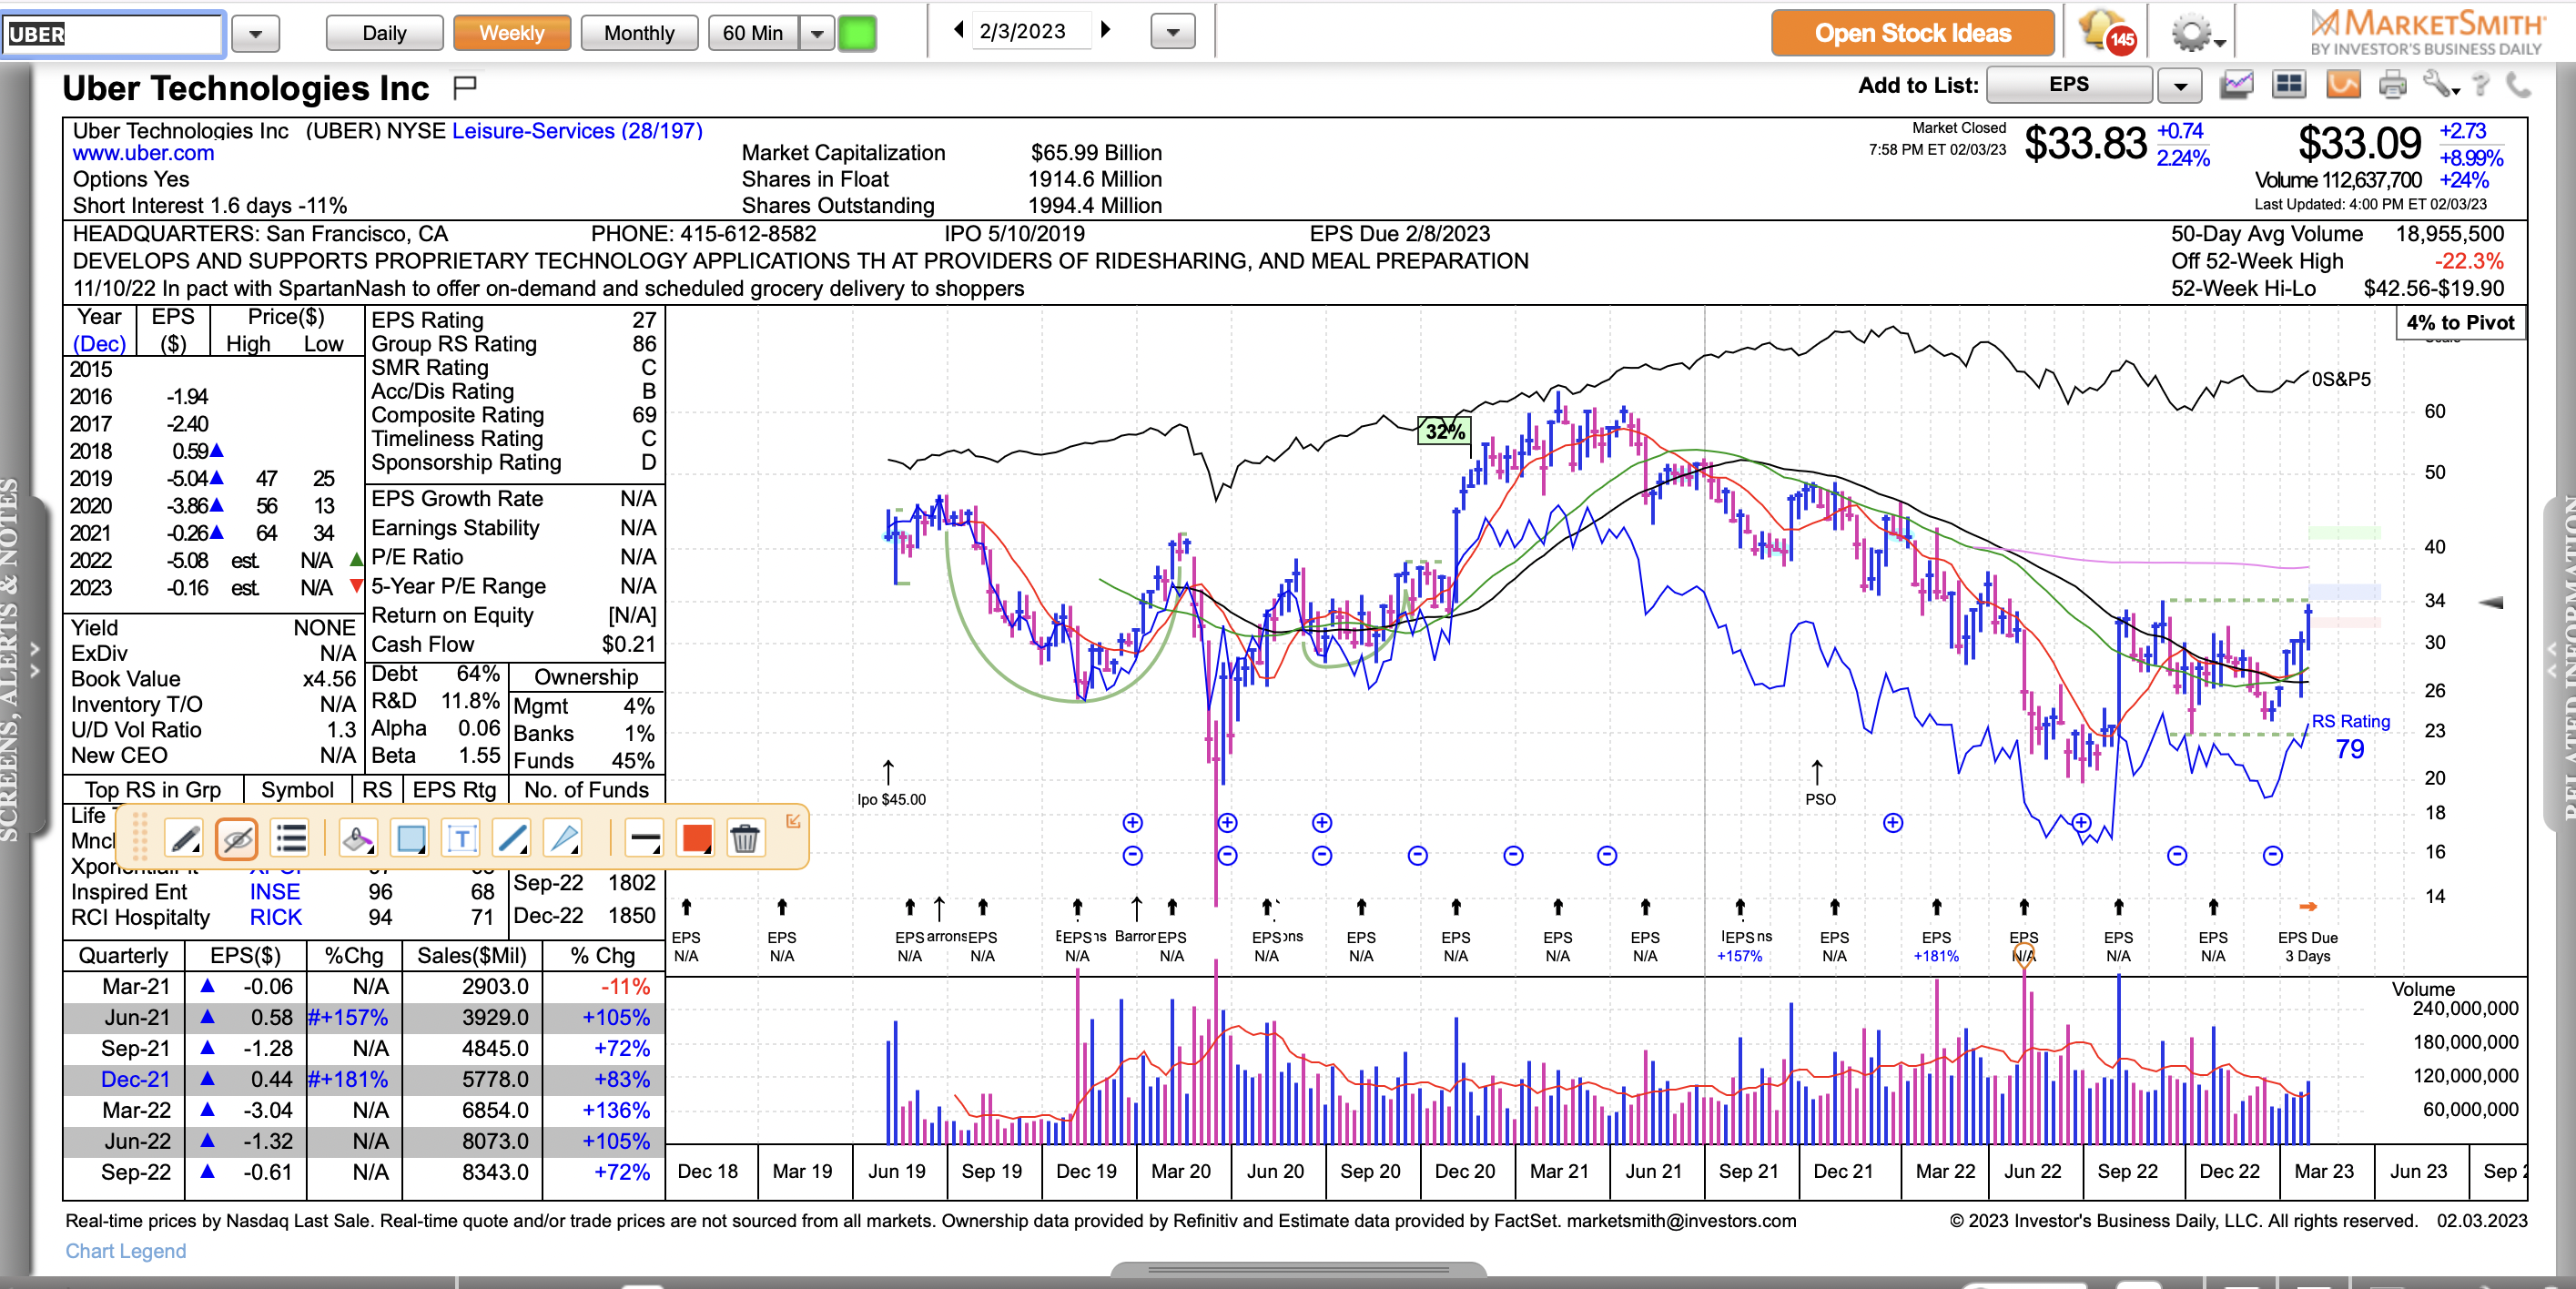 I am in the process of creating a video which uses earnings metrics to identify winning stocks. I believe a stock must have strong earnings and sales in order to make a sustained (12-24 months) uptrend. The fundamentals are roughly 70% of the equation for buying stocks and the technical analysis is 30%.
I hope this answers your questions.
Regards,
Marty
